

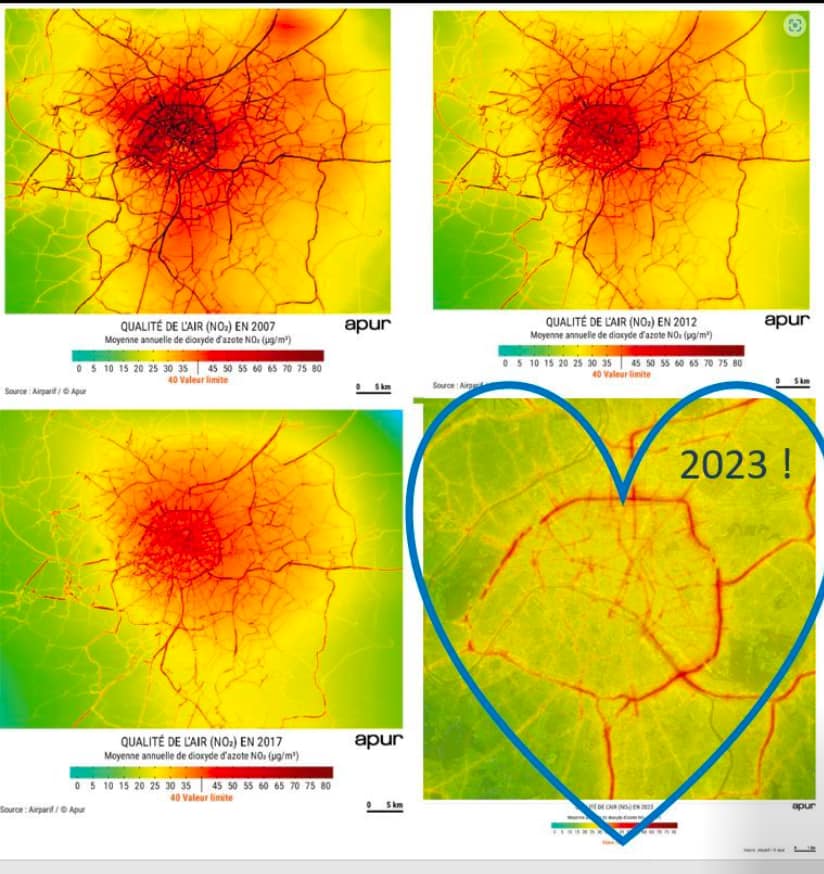
Example network for Paris:
The 2024 Paris Olympics were a huge social and economic success. US cities can become much more walkable before the 2026 World Cup games.
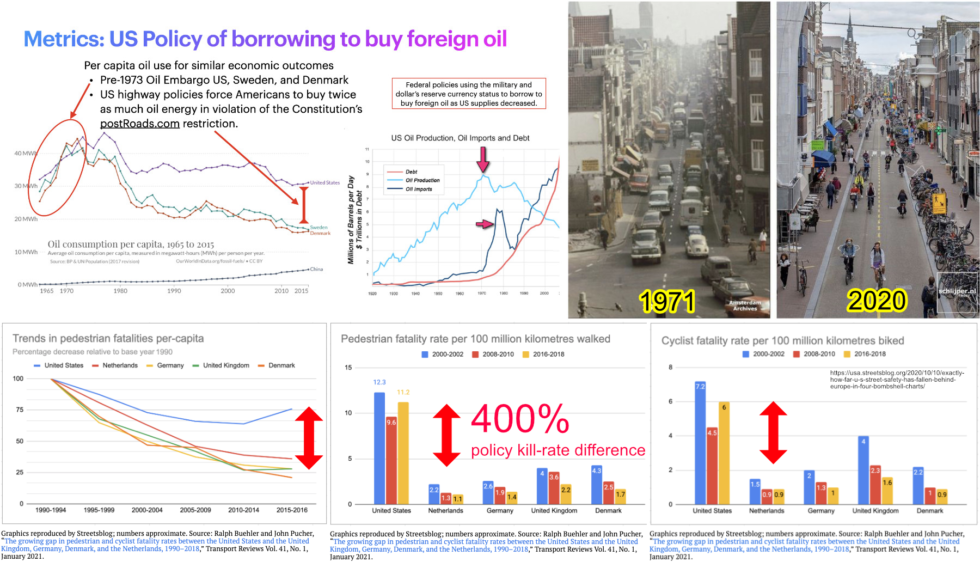
Walkable cities reduce draining their economies from importing oil and cars.
| Mode of Transport | US (NHTS Data) | Paris (2022-2023) |
|---|---|---|
| Car Trips | 83-85% | 4.3% |
| Walking Trips | 8.6% in 2001 to 10.5% in 2017 | 53.3% |
| Biking Trips | 0.9% in 2001 to 1% in 2017 | 11.2% |
| Public Transit | 5% | 30% |
Road designs diverged in the US and Europe following the 1973 Oil Embargo. From the same safety record and 43 MWh of oil use per person per year in 1973, Europe reduced per person oil use to 60% below the US and road-kill of pedestrians/bike riders to 400-600% below the US.
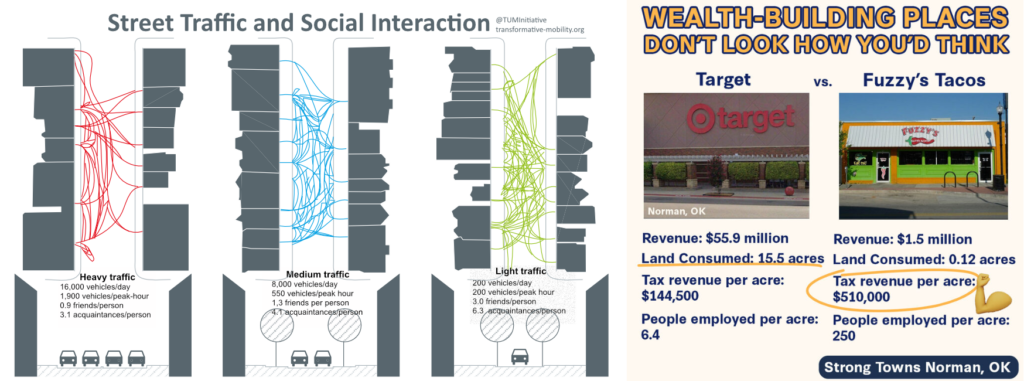
Commerce and Community are pedestrian:
- Commerce is pedestrian: Only 1.2% of land area in the 35 largest US cities are walkable land and generate 20% of GDP.
- Studies show that people on foot may spend up to 65% more than people driving.
- In Brooklyn, redesigning a parking lot into a pedestrian plaza boosted retail sales by 172%.
- Research indicates that walkable shopping areas are often economically successful, and improved walkability tends to increase commercial and residential land values.
- A study in New York City found that shoppers who valued wider sidewalks over parking spent about five times as much money as those who valued parking over sidewalks.
- A 2009 study by Joe Cortright revealed that "In the typical market, an additional one point increase in Walk Score was associated with between a $500 and $3,000 increase in home values".
- Community is pedestrian:
The Olympic Games attracted massive crowds and global attention:
- Over 9.5 million out of 10 million available tickets were sold
- Nearly one million people watched the Olympic road cycling races
- More than 6 million visitors attended celebration sites across France.
- Media Rights-Holders reported record figures, with Paris 2024 anticipated to be the most followed Games ever
- The Olympic web and app reached approximately 300 million people, the highest for any Olympic Games edition
To reduce traffic and improve the transport experience:
- No venues in the Paris region were to be accessible by private motorized vehicles.
- Park-and-ride facilities were set up to connect with the public transport network for those coming from further away.
- The Public Transport Paris 2024 app was created to help spectators:
- Plan their travel.
- Buy transport tickets.
- Get real-time traffic information.
- Find safe cycling routes to venues.
- Paris 2024 encouraged sustainable travel and advised spectators to purchase transport tickets in advance.
- All competition venues were designed to be served by public transport.
- An adapted transport plan was put in place specifically for the Games.
- Public transport services were expanded, with a projected 15% increase in frequency across the system and longer operating hours.
- The goal was for 100% of spectators to reach event locations using public transit or active travel methods like walking and cycling.
- Dedicated bike parking areas were made available near venues, free of charge and staffed around event times.
- An Olympic cycling network was created to link competition venues
The organizers implemented various strategies to keep spectators informed and engaged:
- Spectators were required to log in to the Paris 2024 Tickets app and enter the name of the spectator for each ticket to access venues.
- Spectators were advised to arrive 1.5 hours before their session began.
- Over 100 automated email, SMS, and push notification paths were set up to prepare spectators for their arrival and manage unforeseen issues
- During the Olympic fortnight, approximately 9 million emails, 7 million SMS messages, and 5 million push notifications were sent out.
- A Contact Center handled 450,000 requests during the Olympic period, with 90% resolved through self-service options
Projected Economic Benefits
An independent study by the Centre de droit et d'économie du sport (CDES) at the University of Limoges projects significant economic benefits for the Paris region:
- Net economic benefits are estimated between €6.7 billion and €11.1 billion, with an intermediate scenario of €8.9 billion.
- This impact is expected to come from tourism (30%), construction (28%), and Games organization (42%).
- The legacy phase from 2025-2034 could generate up to €1.85 billion in economic impact, with tourism making up the largest share.
Short-Term Growth Impact
The French national statistics institute INSEE estimates:
- A "Paris Olympics effect" of around 0.3 GDP points growth in Q3 2024.
- This is comparable to the impact of the 2012 London Olympics, which contributed between 0.2 and 0.4 percentage points to UK growth in Q3 2012.
Tourism and Visitors
- Between 2.3 and 3.1 million unique visitors with Games tickets are expected.
- Estimated €2.6 billion in spending by tourists during the Games.
Funding and Investment
- €7 billion in private funding, including media rights, sponsorship, and ticketing.
- €3 billion in public funding, mainly for long-term community projects.
- For every euro of public spending, there is an estimated leverage effect of three euros of economic impact.
Employment Impact
- Nearly 181,000 people are working or set to work in roles connected with the Games.
Long-Term Benefits
- 80% of public investment is going to Seine-St-Denis, addressing needs of disadvantaged communities.
- The Olympic Village will provide 2,800 housing units and two new schools, benefiting 6,000 residents.
Walkability links:
- Stroads are Ugly, Expensive, and Dangerous (and they’re everywhere) [ST05]
- Suburbia is Subsidized: Here’s the Math [ST07]
- Why Bad Street Design is Both Costly and Deadly
- This Ponzi Scheme Might END Suburban Prosperity
- We Keep Losing The Battle Against Traffic. Is This Inevitable
- How public spaces make cities work, Amanda Burden, TED