Mixed Grid™, combining JPods networks with microgrids
Simple summary:
- For simple calculations, JPods network deploy 1 megawatt of collector per mile (at 4 meters wide).
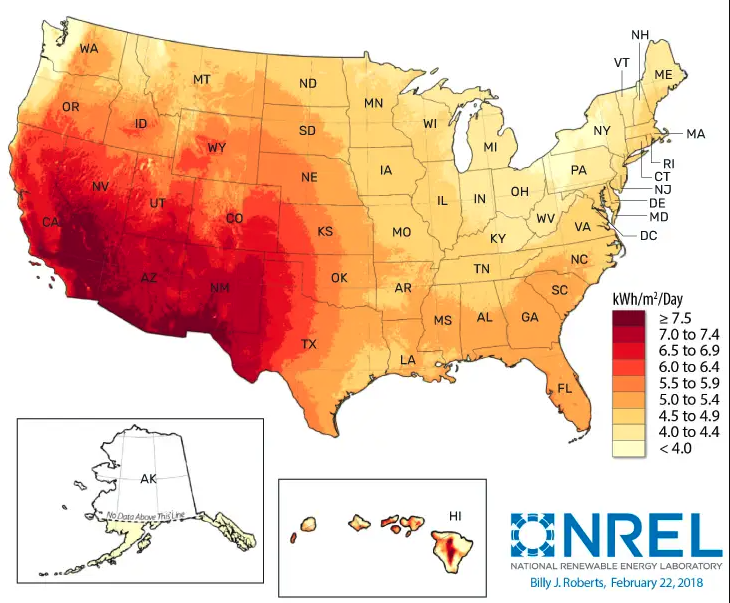
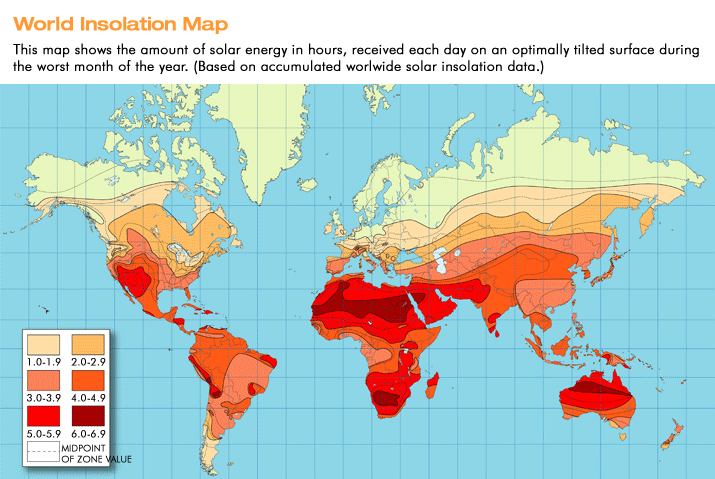
- Power (MWhrs) is the miles of guideway times hours of "noon day sun," typically 3.5-5.5 (daily sun is normally a bell curve from sunrise to sunset. "Noon-day-sun" squishes the bell curve into a square box to get a single value for ease of estimating.
- Macon, GA with 5.2 hours of "noon-day-sun":
- Phase 1: 4 mile network * 5.2 = 20.8 MWhr per day or 832,000 vehicle-miles of power per day
- Phase 2: 68 miles of network * 5.2 = 353.6 MWhr/day or 14,144,000 vehicle-miles of power per day
- Currently there are 100,000 cars in Bibb County. So if JPods replaced 50% of the cars in Macon, the network would gather enough energy for them to each drive 283 miles each day. Currently the average car-miles/year are 13,476, or 36.92 miles/day.
- Macon, GA with 5.2 hours of "noon-day-sun":
- Noon-day sun map
- Power (MWhrs) is the miles of guideway times hours of "noon day sun," typically 3.5-5.5 (daily sun is normally a bell curve from sunrise to sunset. "Noon-day-sun" squishes the bell curve into a square box to get a single value for ease of estimating.
- Energy from the sun per sq meter and calculations of what is recoverable and why.
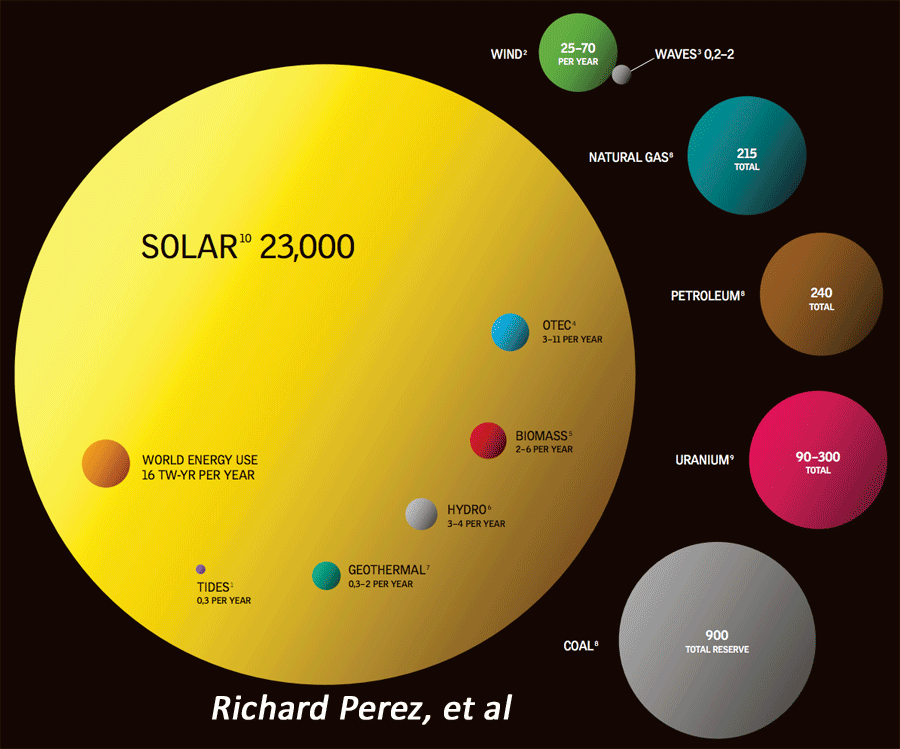
- US DOE page noting the earth is constantly receiving 10,000 times the solar energy than our econoomies need to operate.
- As a thought experiment, consider that oil is just stored solar energy.
- DOE Glossary
- Panel Output by rating
Net Energy and the Energy Cliff
Life requires energy. Less energy, less life.
Net Energy is the most important metric in energy:
- Net Energy is to energy what Profit is to business.
- Net Energy and Profit are what is left over after you have paid all expenses, jobs, interests, capital, taxes, shareholders, and all.
- Net Energy and Profit provide choice beyond subsistence.
- Chris Martenson's Cheap Peak Oil provides an excellent summary of Net Energy.
- Following is a graph of Net Energy and the Energy Cliff. Net Energy below 5:1 is where economies collapse.

Comparison:
- Solar: 22:1 was effect enough for life to form on Earth. Food, wood, oil, natural gas, and coal are all stored solar energy. Nuclear energy is dust from super novas. We must live within a solar budget because, at root level, all energy we can access is solar:
Thomas Edison, 1910:
1910: "Sunshine is spread out thin and so is electricity. Perhaps they are the same, Sunshine is a form of energy, and the winds and the tides are manifestations of energy... Do we use them? Oh, no! We burn up wood and coal, as renters burn up the front fence for fuel. We live like squatters, not as if we owned the property.... There must surely come a time when heat and power will be stored in unlimited quantities in every community, all gathered by natural forces. Electricity ought to be as cheap as oxygen...."
1931: "I'd put my money on the sun and solar energy. What a source of power! I hope we don't have to wait 'til oil and coal run out before we tackle that."
- The Guardian (about 2019): What if Canada had spent $200bn on wind energy instead of oil?
- Wind: 25:1 is very effective and accounts for why US manufacturers were making up 80,000 windmills a year until the Federal goverment monopolized the industry with the Rural Electrication Act of 1936. That policy change wiped out the entire renewable energy industry for half a century and 600,000 windmills were gradually abandoned.
- Oil:
- 1900: Net Energy was a phenomenal 100:1. It was possible to shove a pipe in the ground in Texas and get a 50,000 barrel a day gusher. Those field are now depleted.
- 1970: Net Energy was a very viable 25:1. The Alaska fields, Gulf fields, and others required significant capital and engineering feats with reasonable returns.
- 2020: Net Energy has dropped below 5:1 and is falling off the "Energy Cliff". US Oil Production is collapsing:
- In 2020 US oil production decreased by 2 million barrels per day (EIA).
- 2020, CNBC: OIL AND GAS: Shale industry will be rocked by $300 billion in losses and a wave of bankruptcies, Deloitte says
- 2020, Bloomberg: Frackers Are in Crisis, Endangering America’s Energy Renaissance
- 2019, WSJ: Frackers Scrounge for Cash as Wall Street Closes Doors
- 2018, DeSmog: How Wall Street Enabled the Fracking 'Revolution' That's Losing Billions
- 2018, Columbia Press: Saudi America, The Truth About Fracking and How It’s Changing the World
- 2013, MotherJones: Frackers Are Losing $1.5 Billion Yearly to Leaks
- My wild guess is that Oil Famine will unfold in the 2020 decade without dramatic action to power our economies within a solar budget.
Within a Solar Budget
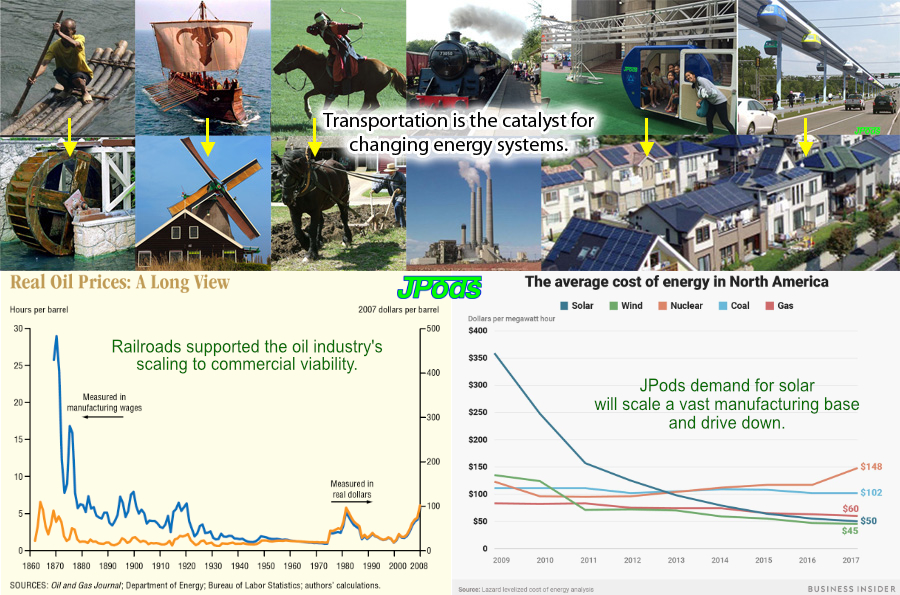
My US Patent solves the problem Edison noted that "Sunshine is spread out thin and so is electricity". Grade separate and robotize the transportation network to cut energy needs by 95% and use the distriuted nature of that network to gather the energy to power it.
- Networks of self-driving cars: “A method of controlling a transportation System for moving people, freight, and any combination whereof using a distributed network of intelligent devices without requiring the aid of a human driver”
- Solar-powered mobility networks: “The method... providing... Solar and wind power generators integrated into the physical Structure of Said transportation System....”
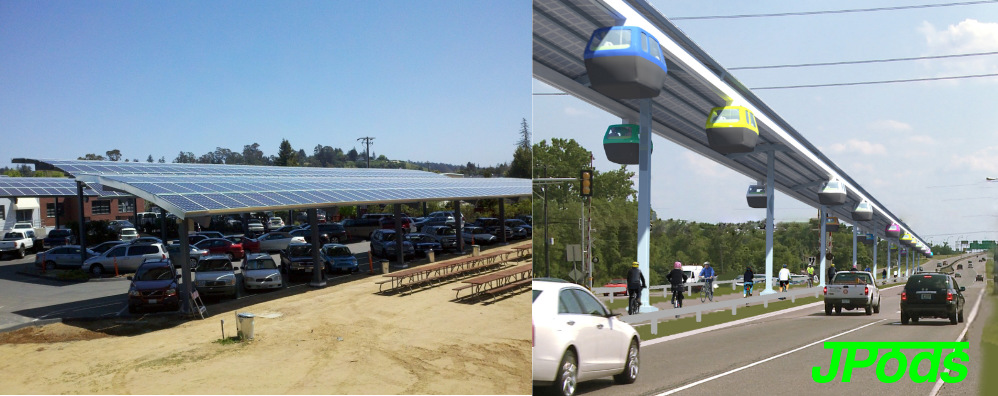
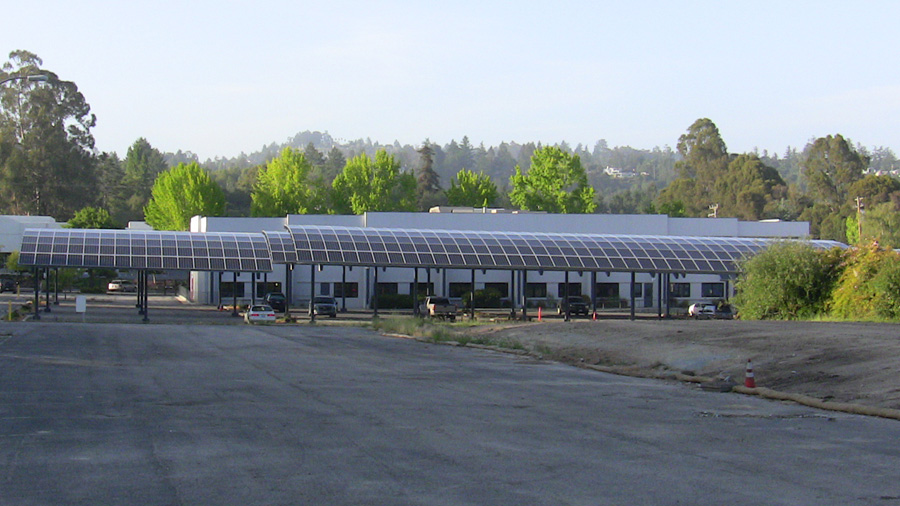
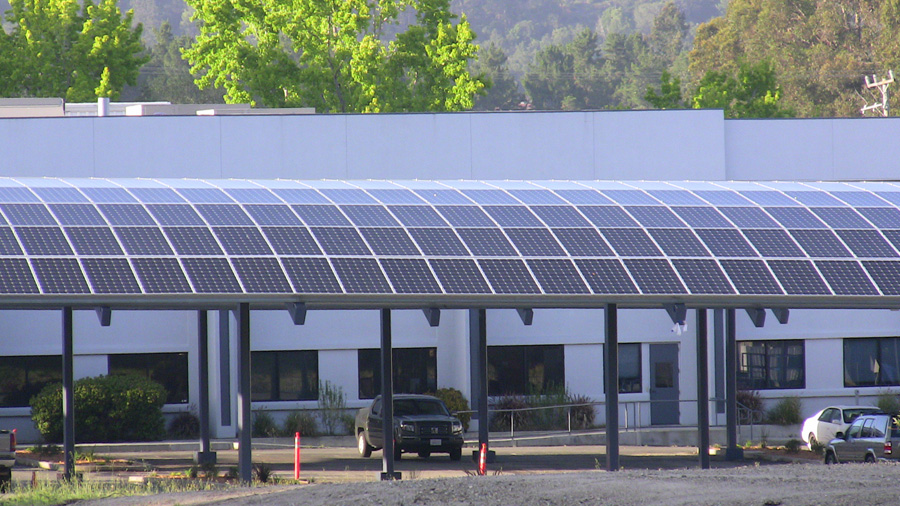
On the left is an implementation of the Solar Collection System created by Swenson Solar, Santa Cruz, CA. Examples of solar collector systems designed for deployment over JPods rails applied to the parking lot at Plantronic's Headquarters in Santa Cruz, CA
Over the JPods rails, collectors will typically be 4 to 10 meters, this unit is 6.7 meters.
JPods solar collectors will typically be 4 to 10 meters wide, this unit is 10 meters.
The units are curved. There is a small sacrifice of efficiency for this curved shape but this is more the compensated for by the improved aestetics. Aestestics are critically important.

Solar collection applied to JPods networks produces about 50,000 vehicle-kilometers of power per kilometer per day. Following is a summary of the Production and Consumption to back these numbers:
Energy Production:
The following links and data update about every 15 minutes based on Plantronics 375 units:
- This is an installation of 3 arrays, 10 meters wide, and 80 meters long. in the field for several years.
Yearly kw-hr collections on this 240 meter long, 10 meter wide array averages 367,410 for the last five full years. This equates to 4.19 megawatt-hours per day per kilometer. The weather conditions in Santa Cruz include a heavy marine fog layer for several hours each morning in the summer. This results in a solar input of about 4 Peak Sun-Hours per day .
| 1/1/12 | 381,393.09 |
| 1/1/13 | 390,195.19 |
| 1/1/14 | 355,894.66 |
| 1/1/15 | 367,895.4 |
| 1/1/16 | 341,675.91 |
Energy Consumption:
JPods vehicles require about 38.5 watt-hours to travel a kilometer. Here is a link to the Physics of JPods with associated calculations. This budget is increased to 79 watt-hours per kilometer to account for heating and airconditioning.
By dividing the 4 megawatt-hours collected each day by the 79 watt-hours required to move, heat and cool a JPods vehicle per km, results in about 50,000 vehicle-km of power per km per day.
Collection system by Frank Pao for over JPods stations. These systems are not designed to be as efficient as possible but to create "light play" in station areas.
Energy Resources:
Methane is the battery Edison was looking for. Personal Energy Servers combine into the Distributed Grid. Go to DistributedGrid.com.

Random articles on solar:
- Bloomberg: Solar Could Beat Coal to Become the Cheapest Power on Earth
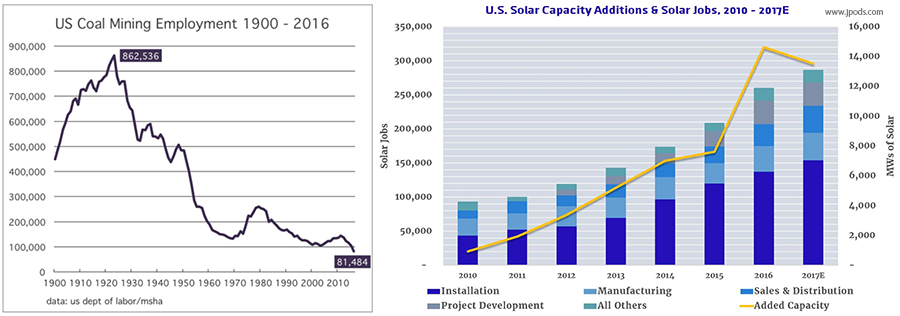
- Solar Jobs Versus Installed Capacity 2016
- JPods deploys about 1 megawatt of solar collection per mile of rail. About 500,000 miles of JPods and other solar-powered mobility networks will be built in the US as soon as liberty to innovate is restored.
https://www.utilitydive.com/news/texas-solar-and-wind-resources-saved-co...


